A (shallow) Dive into VSCode Debugger
I know debugging skills are very important and one of the “must have” skills for developers. However I did not explicitly tried to learn how to use and utilize VSCode debugger effectively. While reading this during my entry to c++, I thought now was the right time to look into features VS Code gives, which were worth note taking. Today is just a shallow dive and hope to learn deeper when I need it.
Don’t neglect learning to use a debugger. As your programs get more complicated, the amount of time you spend learning to use the integrated debugger effectively will pale in comparison to amount of time you save finding and fixing issues.
learncpp
Installation
Configuring development environment is especially important when it comes to C/C++. Since VS Code only has built-in supports for TypeScript, JavaScript, and Node.js, if we are using other language such as Python or C++, we would need to install debugging extensions from the VS Code Marketplace (use Ctrl/Cmd + Shift + X as a shortcut)
If what you are trying to compile is simple enough(especially if it’s just one file you’re trying to debug), default configuration works fine. So to experience the VS Code debugging, just click ‘Run and Debug’ section on the left corner and click the run and debug (or just type F5 as a shortcut). If the directory you’re trying to compile is complex, you would need to configure/edit .vscode/launch.json manually (which I will explore more in the future ..)
Stepping
One of the most basic and frequently used debugging function is stepping, which sequentially proceeds statement based on line or breakpoints(we will cover breakpoints soon).
Note: Shortkeys mentioned are based on Windows keyboard and may differ in different devices!
Step into(F11): executes the next statement(next line) in normal execution path of the program. Will enter function calls and execute them line by line, recursively.
Step over(F10): executes the next statement like Step into but will skip line-by-line function execution and return control after the function has been executed.
Step out(Shift+F11): Does NOT execute the next line of code. It executes all remainig code in the function currently being executed. Usually used when you accidently stepped in but don’t want to look into the details of function.
Breakpoints
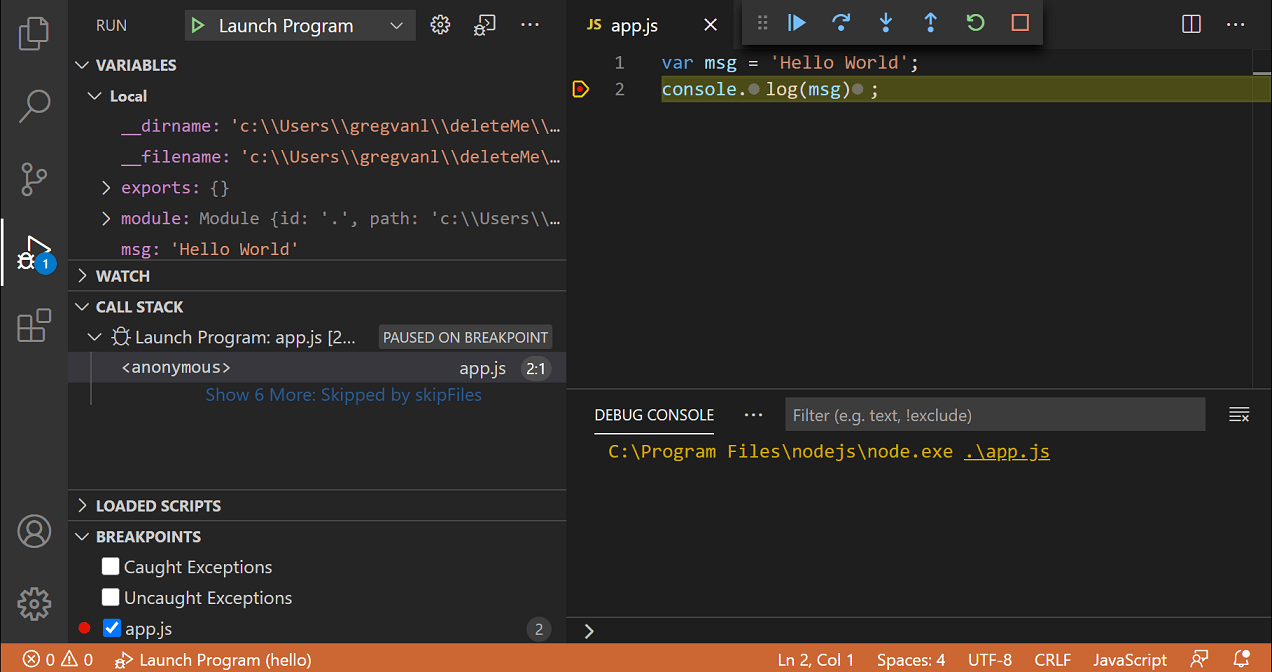
this image is from the VS Code Docs!
Breakpoints are one of the main features of debugging. They capture the state of variables, call stack, and loaded scripts on the lines where breakpoints are placed.
Note that you can actually modify values in the state variables as you want!
You can click on the editor margin or use F9 on the current line to set/unset breakpoints.
Conditional Breakpoints
This is a feature I’ve never used before but seems very helpful. Conditional Breakpoint only hits when it meets the condition specified.
There are three types of conditions:
- Expression condition: The breakpoint is hit whenever the expression evaluates to
true. - Hit count: controls how many times a breakpoint needs to be hit before it interrupts execution. Whether a hit count is respected, and the exact syntax of the expression, can vary among debugger extensions.
- Wait for breakpoint: The breakpoint is activated when another breakpoint is hit
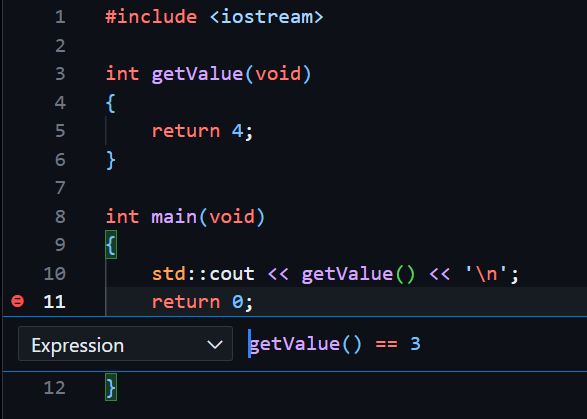
For example (Expression condition), if I set getValue() = 3 in line 11 in the below code, it will pass the breakpoint.
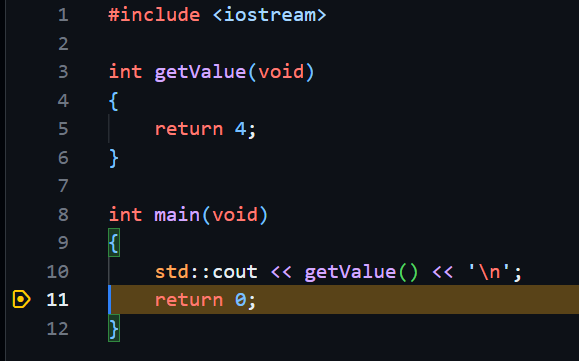
But if I set getValue() = 4
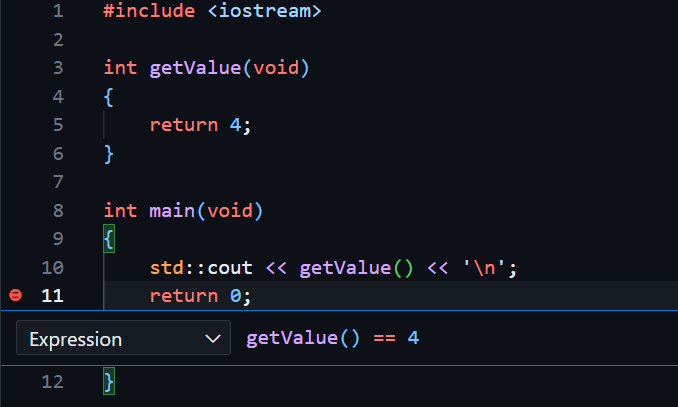
it will correctly stop at the breakpoint.
To create conditional breakpoint, right-click in the editor margin and select Add Conditional Breakpoint.
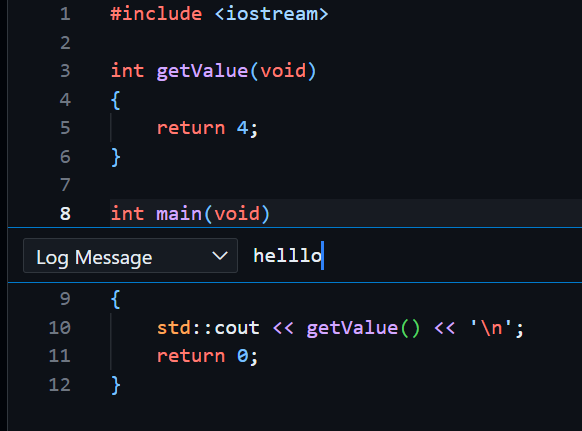
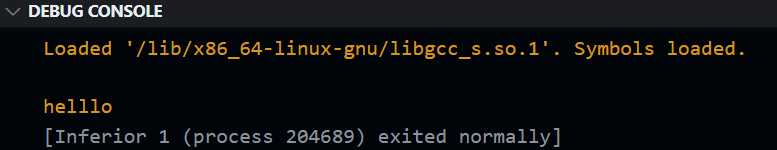
Log Points
A logpoint is a variant of breakpoint, but works differently. Instead of stopping at a point, whenever it passes that line, it prints a log message in the debug console.
This feature is for easy/light log message addings.
For example if I
Debugging C++ in VS Code
Visual Studio Code supports the following debuggers for C/C++ depending on the operating system you are using:
- Linux: GDB
- macOS: LLDB or GDB
- Windows: the Visual Studio Windows Debugger or GDB (using Cygwin or MinGW)
since I use WSL(Windows Subsystem for Linux) 2 as my dev environment, I use GDB debuggers.
WIP
I will add some more (something beyond tutorial resources) information and practical tips on debugging to this post as my journey continues ..
Resources
https://code.visualstudio.com/docs/debugtest/debugging
https://www.youtube.com/watch?v=3HiLLByBWkg
https://code.visualstudio.com/docs/cpp/cpp-debug
https://www.learncpp.com/cpp-tutorial/using-an-integrated-debugger-stepping/